Introducing dark mode for Datadog
Datadog | The Monitor blog

Introducing dark mode for Datadog


Summary

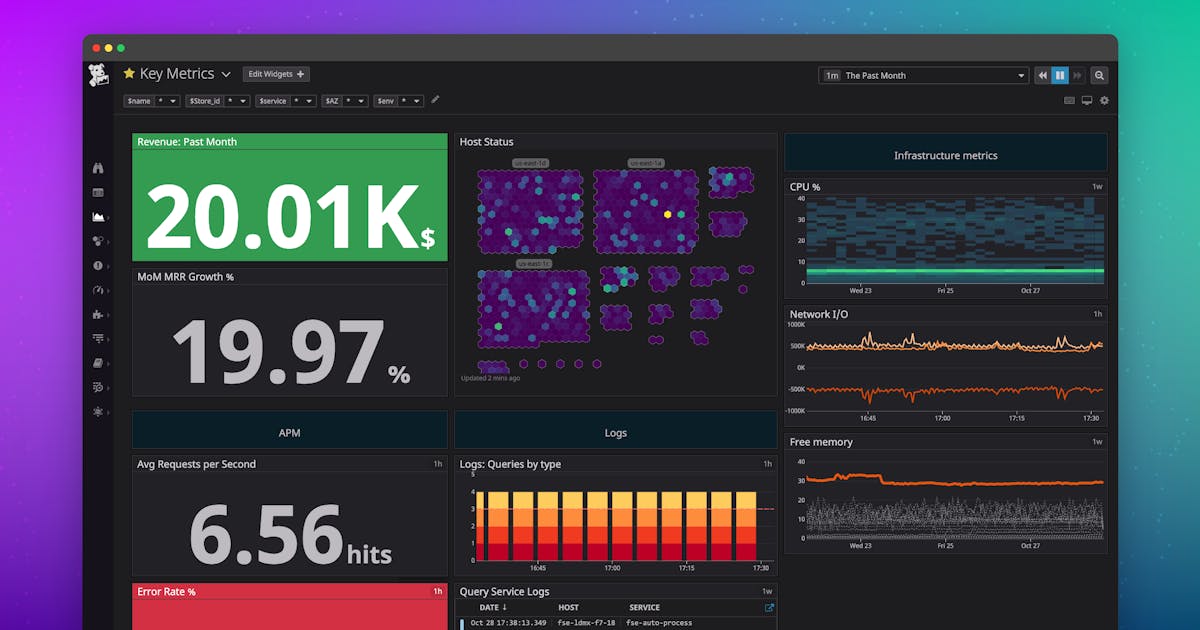
This Datadog article details how to effectively monitor SQL Server performance using Datadog's integration. It explains how to collect key metrics like query performance, resource utilization, and database health, enabling proactive identification and resolution of performance bottlenecks. By leveraging Datadog's dashboards, alerts, and service maps, teams can gain comprehensive visibility into their SQL Server environments and ensure optimal database operation.
Read the Original Article

This article originally appeared on Datadog | The Monitor blog.

Read Full Article on Original Site

Popular from Datadog | The Monitor blog

1
Datadog LLM Observability natively supports OpenTelemetry GenAI Semantic Conventions
2
Introducing Bits AI Dev Agent for Code Security

Datadog | The Monitor blog Mar 26, 2026 88 views

3
Understand session replays faster with AI summaries and smart chapters

Datadog | The Monitor blog Apr 2, 2026 73 views

4
Monitoring MongoDB performance metrics (MMAP)

Datadog | The Monitor blog May 25, 2016 73 views